cdist vs. pdist
c是 cross 的意思,每个都做,MxN 的 matrix;p 是 pair 的意思,只返回 unique 的 pair,1d distance。
import numpy as np
from scipy.spatial.distance import pdist, cdist, squareform

A = np.array([[0, 0],
              [1, 0],
              [0, 1]])
cdist(A, A): between two sets, returns full 2D matrix
[[0.         1.         1.        ]
 [1.         0.         1.41421356]
 [1.         1.41421356 0.        ]]
pdist(A): within one set, returns condensed 1D array of unique pairs
[1. 1. 1.41421356]
pdist 转换成 matrix 的 cdist
squareform(pdist(A))
1D distance:
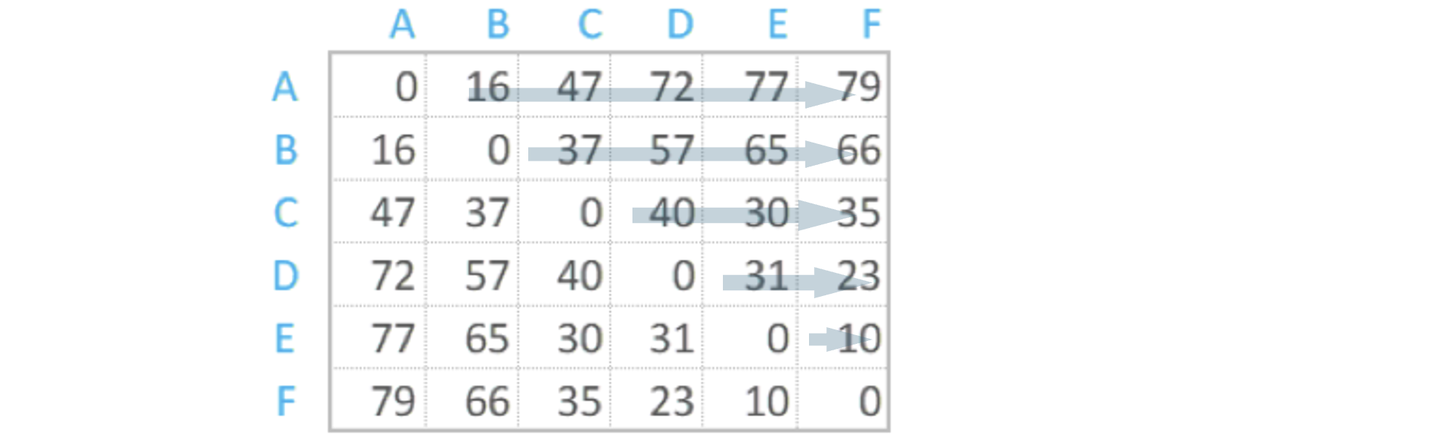
添加图片注释,不超过 140 字(可选)
linkage
linkage 可以输入 两种数据,一种是 feature table,行是sample,column是features。另一种是1d distance
用法如下
from scipy.cluster.hierarchy import linkage,fcluster,dendrogram
linkage(distances, method='ward') # 这里用ward方法,也可以试别的
如果是二维的distance matrix,可以用
from scipy import spatial
import numpy as np
distance_grid = np.array([
    [0, 299, 180, 170, 89],
    [299, 0, 118, 129, 209],
    [180, 118, 0, 10, 90],
    [170, 129, 10, 0, 80],
    [89, 209, 90, 80, 0]
])
y = spatial.distance.squareform(distance_grid)
Custom distance
计算一个1D的distance for linkage
def compute_distance_matrix(df,func=distance_func):

    n = len(df)
    dist = []
    for i in tqdm(range(n)):
        for j in range(i+1, n):
            d = func(df.iloc[i].values, df.iloc[j].values)
            dist.append(d)
    return np.array(dist)
画图
dendrogram
height=(len(Z)+1)//8

plt.figure(figsize=(5,height))
dendrogram(Z, orientation='left', leaf_font_size=7, color_threshold=cut_threshold,**kwargs)
plt.title('Hierarchical Clustering Dendrogram')
plt.ylabel('Distance')
通过画图,调整color threshold,然后用这个threshold去cut tree
Cut tree
labels = fcluster(Z, t=0.03, criterion='distance')
生成的就是cluster Id