pd.Series(series,copy=False)
copy=False可以如果input已经是series,那就不需要重新copy了
df.hist(column, by, bins, figsize)
除了series.hist,还有df.hist也很好用,by可以画多个图。
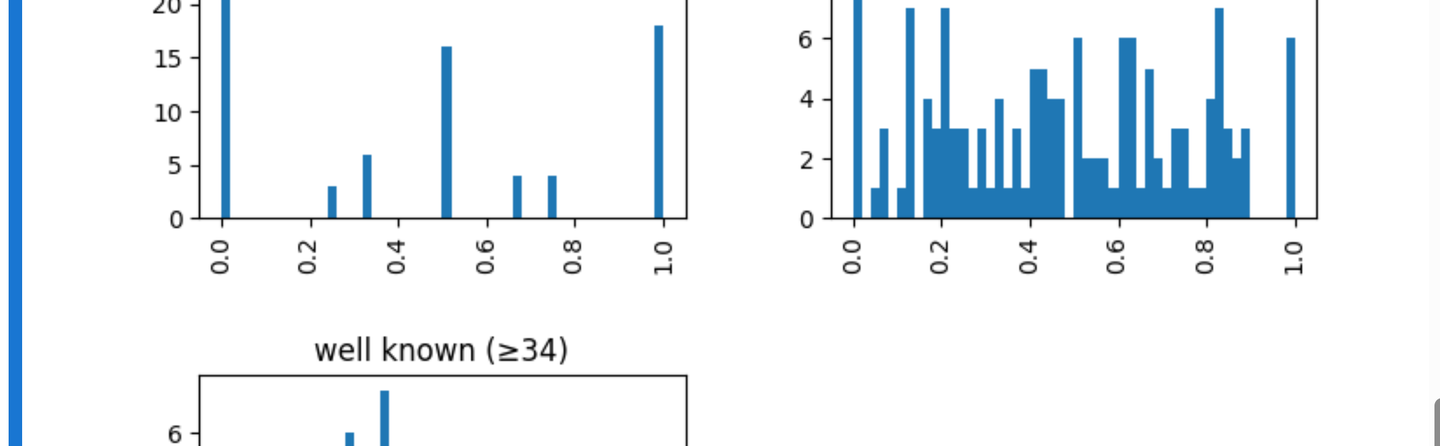
df.hist(column='accuracy', by='category', bins=50, figsize=(8,6))
加上by之后,效果类似这样
添加图片注释,不超过 140 字(可选)
series.quantile(num)
可以得到percentile的数。
比如median是.quantile(0.5)
里面也可以是list of number, 比如.quantile([0.75,0.25])会返回这样的series
0.75    22.0
0.25     0.0
index.get_loc(str)
可以得到name的location
df.index.get_loc('aa') #返回一个整数
series.name
如果是axis=1,横着的series,那么它的index是column names, 那如果要想得到row index,可以用.name得到。
series.nlargest
返回最大的几个 in series
比如
series.nlargest(10)

# return below
60847     5.319798
100287    4.770354
91919     4.567012
dropna
axis为1是drop column,为0是drop index
df.dropna(axis=1,how='any')
axis default是0,how的default是any
index 和column用map而不用apply
这两个都属于pd.Index类,apply不可以用,但可以用map
df.index.map(lambda x: x.replace('S','s'))
而不需要[func(i) for i in df.index]
series的index也可以用map,然后如果是multilevel index (tuples)的话,想要combine index,可以这么做
series.index = series.index.map(lambda x: x[0] + '_' + x[1])
也可以这么转化,之前是
series[series.index.str.contains('R')]
用lambda的话就是
series[lambda x: x.index.str.contains('R')]
pd.crosstab
下面的这个:
df.groupby('site')['group'].apply(lambda x: x.value_counts()).unstack(fill_value=0)
和这个的效果是一样的:
pd.crosstab(df['site'], df['group'])
本质上就是把site 作为index,然后类似groupby,不过算value counts, 直接把group作为column展开。
apply 里的function return pd.Series
apply 里的function return pd.Series 可以直接return 一个 dataframe
df.apply(lambda r: pd.Series(func(r)),axis=1)
这里的func 会输出dict, 用pd.Series在外面包上可以直接return dataframe
设置max display
pd.set_option('display.max_rows', 5)
pd.set_option('display.max_columns', 100)
raise error overwriting
设置这个
pd.set_option('mode.chained_assignment', 'raise')
可以防止copy里修改会影响到源df
df = pd.DataFrame({'A': [1, 2, 3]})
subset = df[df['A'] > 1]
subset['A'] = 99  # <-- This is a chained assignment
iterate rows
df.iterrows() , 这个方法比较慢,return 的r是pd.Series
for i,r in df.iterrows(): break
如果不需要index name,还有一个非常快的方法,就是df.values
for r in df.values: break
RAPIDS
Reference:
先安装cudf和cuml
查看cuda version: nvcc --version
12的话就选中CUDA 12

添加图片注释,不超过 140 字(可选)
pip install --extra-index-url=https://pypi.nvidia.com "cudf-cu12==25.2.*" "cuml-cu12==25.2.*"
然后在import pandas前加上 %load_ext cudf.pandas
%load_ext cudf.pandas

import numpy as np, pandas as pd
groupby + sum()
df.groupby(['big group', 'small group'])['value'].sum()

# if using count, or value=1
df.groupby(['big group', 'small group']).size() #如果是count,用siz()
size()不像count(),还会包括NaN,它是统计每个group有多少行。
groupby + agg()
default的string term
df.groupby('Category')['Values'].agg(['sum', 'mean', 'count'])
自定义个func,注意func的argument,如果前面划定是column, x就是Series, 如果没有划定,直接groupby(col).agg(),那么x就是dataframe
def range_func(x):
    return x.max() - x.min()

# Apply custom function
result = df.groupby('Category')['Values'].agg(['min', 'max', range_func])
dict, {column_name: default term, column_name: func}
df.groupby('Category').agg({'Values1': 'sum', 'Values2': 'mean'})
用customize func的速度往往比built in 的速度慢很多很多,比如sum, size等。
简单的算法优先考虑built in 的。如果觉得慢,用GPU加速的RAPIDS里的cudf 和cuml, 参考"%load_ext cudf.pandas"
max(),mean()总是压缩所有的row,默认axis=0
pd.factorize 把category 转成integer
会return 两个,第一个是转好的,另一个是unique
>>> codes, uniques = pd.factorize(np.array(['b', 'b', 'a', 'c', 'b'], dtype="O"))
>>> codes
array([0, 0, 1, 2, 0])
>>> uniques
array(['b', 'a', 'c'], dtype=object)
or and in string regex
use | as or
df.columns[df.columns.str.contains('rnk|rank')
where
np.where, condition, if true value, if false value
np.where(df.index.isin(idxs),df.index,'')
np.log2 + where
np.log2(df['value'],where=df['value']>0)
where不包括的部分keep 原来的value
df.col.where
df.index.where(df.index.isin(idxs),'')
用一个df更新另一个df
用df2的内容更新df1的一些line,用drop_duplicates里的keep=first
combine = pd.concat([new,df]) # note new is in front
combine = combine.drop_duplicates(subset='name',keep='first')
查找overlap和多出来的index/column
交叉:
df1.index.intersection(df2.index)
unique to df1
df1.index.difference(df2.index)
union结合
df1.index.union(df2.index)
在整个df中搜索关键字,类似ctrl+F
loc = df.applymap(lambda x: 'keyword' in str(x)) #会return一个和df相同shape的bool matrix

# 注意str(x)
之后结合df.any(axis=0/1)
loc.any(axis=1) # index name, bool series
loc.any(axis=0) # column name, bool series
to_dict
可以从series 建立dictionary
dct1= df.set_index('key_column')['item_column'].to_dict()
dct2= df.set_index('key_column2')['item_column2'].to_dict()

dct1.update(dct2) #如果两个dict有重叠,dict2会覆盖dct1
map+dict.get(),如果dic里没有key,用原来的
df.index.map(lambda x: your_dict.get(x,x))
idxmax, 找到每行最大值的name
df.idxmax(axis=1) # 每行最大
loop df[col].items()
for k,v in df[col].items()
query from dict 比 pd.Series快得多
df[col].to_dict()
Explode
df.col.str.split(‘_’)后
df.explode('colname')
或者
df.explode('colname',ignore_index=True)
Reverse row order, 适用于df.X.plot.barh()
df.iloc[::-1]
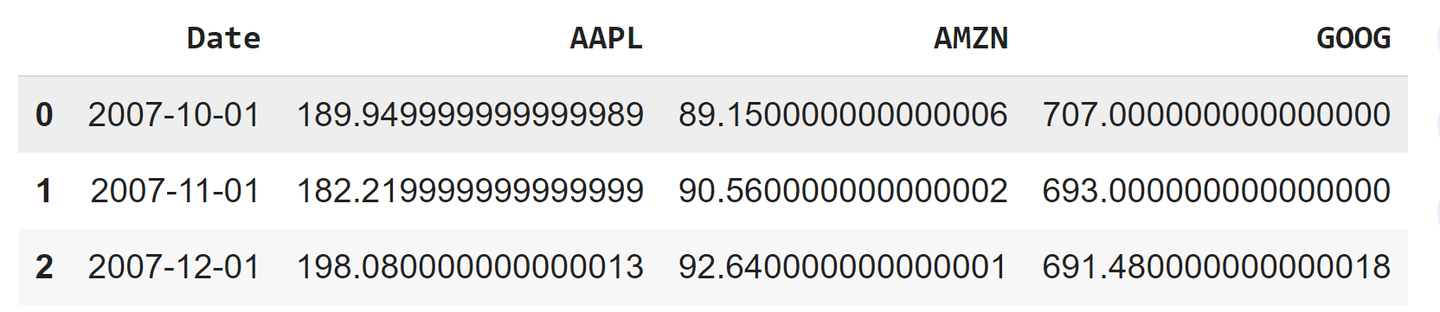
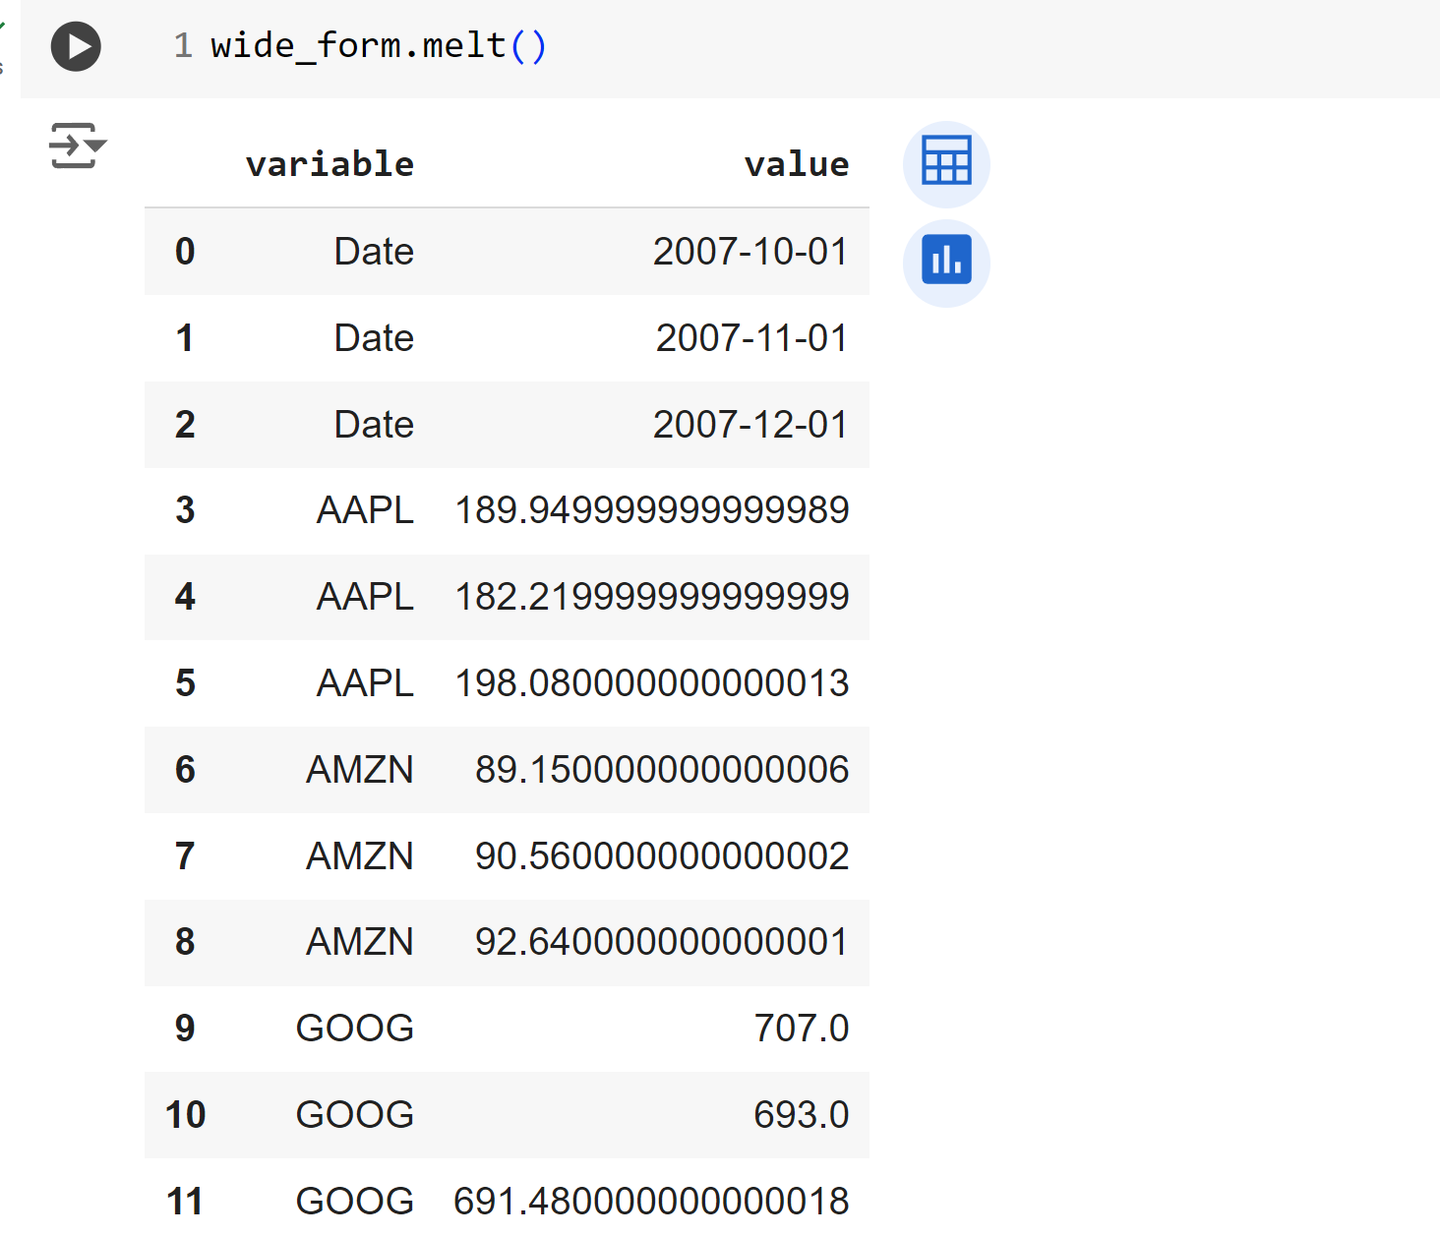
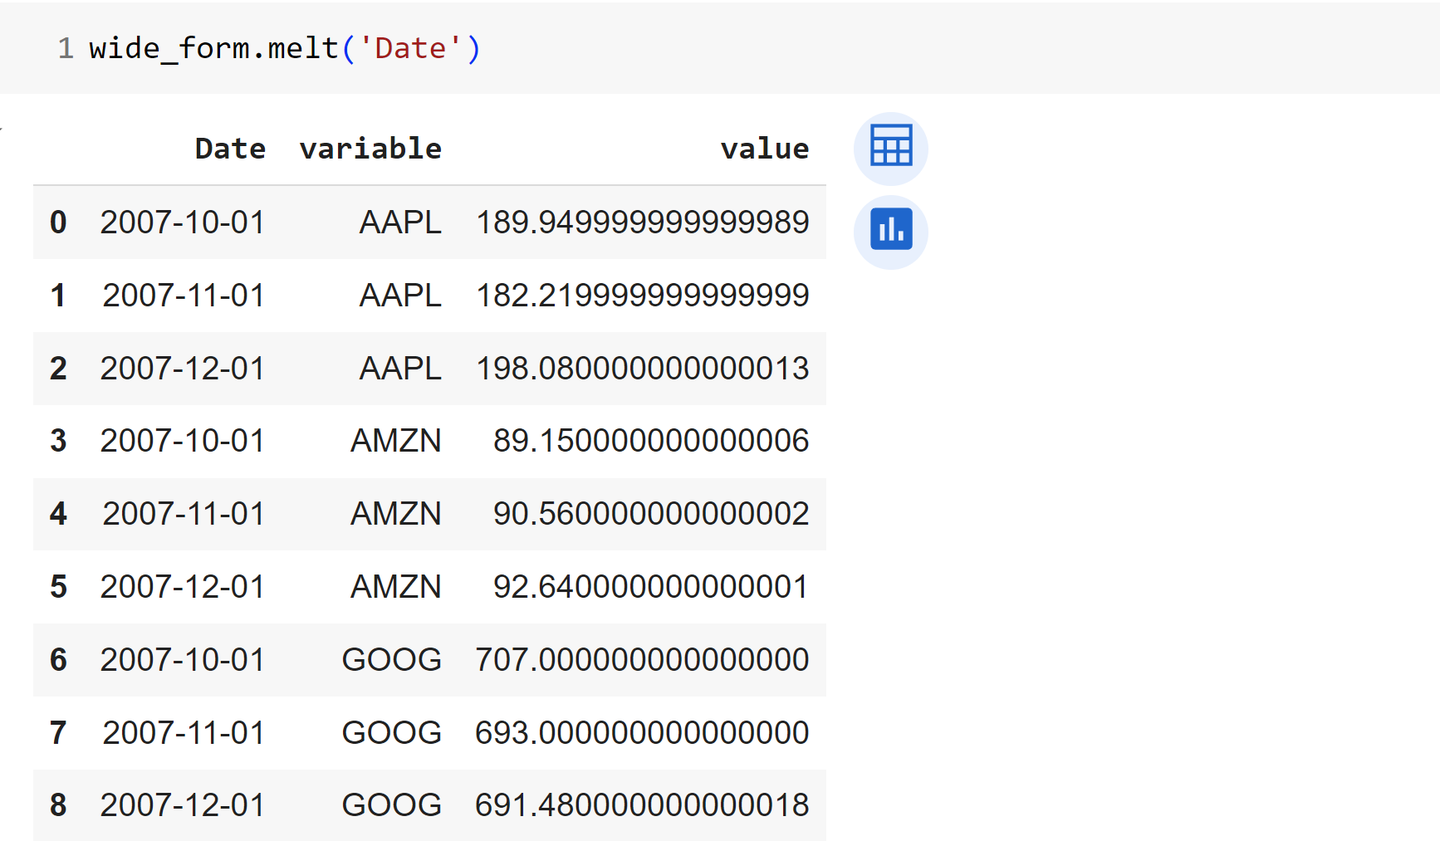
melt, wide form-->long form
类似于unstack,可以设置id_var就是不动的column,之后其余的column会被unstack
df.melt(id_vars='v')
wide form:
添加图片注释,不超过 140 字(可选)
直接melt
添加图片注释,不超过 140 字(可选)
fix idx melt
添加图片注释,不超过 140 字(可选)
Pivot
如果要long form -->wide form,用pivot,比如:
long_form.pivot(index='Date', columns='variable', values='value')
pivot_table实在pivot的基础上,额外允许aggfunc
df.pivot_table(index='A', columns='B', values='C', aggfunc='sum')
merge on, suffixes
merge不仅可以根据一个column,还可以根据多个column;另外,多余的column name还可以加上suffixes以区分他们来自哪个df。
df1.merge(df2,on=[col1,col2],suffixes=('_1','_2')
把有两个suffixes的column 合并到一起,可以用到filter(func, list item),把nan的那个去掉,比如
df.apply(lambda row: '|'.join(filter(pd.notna, [row['source_1'], row['source_2']])), axis=1)
sort_values(by=multiple columns)
sort_values可以不止一个column,可以多个。
df.sort_values(by=['name', 'number'])
还可以指定ascending=[False, True]
比较两个dataframe是否相等
有的时候df1==df2并不work,因为浮点问题,这个时候可以用np.isclose
np.isclose(df1, df2)